Scalable forensics timeline analysis using Dissect and Timesketch
This blog post is also published on the website of my employer, Hunt & Hackett, which has given me the opportunity and inspiration to develop this type of incident response solution.
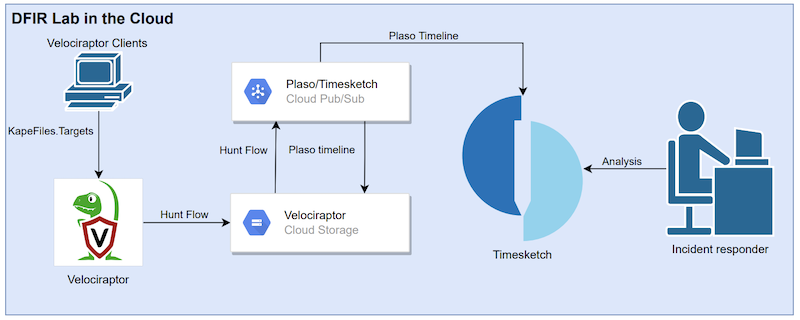
If you work in incident response, you know that processing data from multiple systems can be a time-consuming and challenging task. In the previous blog post titled “Automating DFIR using Cloud services”, I shared the DFIR Lab and my thoughts on how to automate DFIR processes. Fox-IT has since released Dissect, an incident response framework that uses artefact parsers and plugins to gain access to forensics artefacts through various implementations of file formats.
Forensics timeline analysis is a technique commonly used in digital forensics to reconstruct the events that have occurred on a system. This technique involves analyzing logs and forensic artefacts such as filesystem metadata to create a record of events. It is particularly useful during incident response cases where identifying attacker activity is necessary to determine the potential threat posed by an attacker or to answer questions about how a security incident occurred.
This is where Dissect comes in handy because it has the functionality to not only create a timeline of events but also acquire data from systems. In this blog post, I will explain how Dissect can be used during the acquisition and processing phase of an incident response case to perform timeline analysis using Timesketch. Besides the features mentioned, Dissect has many other features like hypervisor data collection.
Before we dive into the details, it’s important to note that this blog post assumes you have a basic understanding of how Dissect and Timesketch work.
Acquire
To create “forensics packages” for Windows, Linux, or Mac OS systems, Velociraptor Offline Collector or Acquire (which uses Dissect) can be used. These tools enable the collection of logs and forensic artefacts in packages that can be uploaded directly to object-based storage systems. What’s particularly advantageous is that forensics packages can be created for a large number of systems in a matter of minutes, which can be automatically uploaded to an incident response lab for processing and analysis.
Dissect Target understands the output of Velociraptor and Acquire thanks to the use of loaders (tar, velociraptor). The MSEDGEWIN10.tar acquire container will be used as an example.
Processing
Now that we have acquired data from a large number of systems, the next step is to process it using Dissect Target. Dissect Target has a collection of artefact parsers and plugins that can parse various forensics artefacts and logs such as Windows Event log, MFT, Runkeys and more.
Using the MFT function a single entry is shown as a record, which is the primary output type of Dissect Target functions. Using rdump the records can be read and transformed into other formats.
target-query -t MSEDGEWIN10.tar -f mft --limit 1 | rdump -J  | jq
[reading from stdin]
{
  "hostname": "MSEDGEWIN10",
  "domain": null,
  "creation_time": "2019-03-19T21:52:25.169411",
  "last_modification_time": "2019-03-19T21:52:25.169411",
  "last_change_time": "2019-03-19T21:52:25.169411",
  "last_access_time": "2019-03-19T21:52:25.169411",
  "segment": 0,
  "path": "c:/$MFT",
  "owner": "S-1-5-18",
  "filesize": 130023424,
  "resident": 0,
  "inuse": 1,
  "volume_uuid": null,
  "_source": "MSEDGEWIN10.tar",
  "_classification": null,
  "_generated": "2023-02-26T13:37:43.166653",
  "_version": 1
}
Looking closely shows that the record does not contain one event but four events:
creationmodificationaccesschange
Depending on the tool you use to perform analysis this introduces a blind spot if different datetime fields are used when viewing a timeline of events in chronological order.
To solve this problem rdump has the feature --multi-timestamp, which creates records for each datetime field in a record. This feature was added without the modification of every Dissect Target function.
target-query -t MSEDGEWIN10.tar -f mft --limit 1 | rdump -J --multi-timestamp
[reading from stdin]
{"ts": "2019-03-19T21:52:25.169411", "ts_description": "creation_time", [...]}
{"ts": "2019-03-19T21:52:25.169411", "ts_description": "last_modification_time", [...]}
{"ts": "2019-03-19T21:52:25.169411", "ts_description": "last_change_time", [...]}
{"ts": "2019-03-19T21:52:25.169411", "ts_description": "last_access_time", [...]}
Now that we know how to create a timeline of events using Dissect, we need to scale it up. At the time of writing dissect has a total of 122 functions (including namespace functions) that output records, as shown by executing target-query -l | grep "output: records".
To process the Acquire container MSEDGEWIN10.tar with all these functions, we can use xargs to execute the functions in parallel. However executing rdump --multi-timestamp on all 122 JSON files can take longer than necessary, depending on the number of records each function outputs. In the case of a Windows system executing rdump on the output of the MFT function that mainly outputs most of the records of all functions, causesrdump to be still busy with the output of the MFT function while the output of the other functions is already processed.
To optimize the processing time, rdump has the feature --split COUNT that splits the output into multiple files, where COUNT is an integer that represents the maximum number of records in each file. By using xargs and splitting the JSONL output of the plugins into chunks of files with 10,000 records or less, we can improve the processing of records efficiently.
mkdir -p export/plugins

# Create a list of functions that output records
target-query --list | grep ' -' | grep 'output: records' | grep -vE 'yara|remoteaccess\.remoteaccess|browser\.history|get_all_records|example' | awk '{print $1}' > FUNCTIONS

# Execute the functions and output in split JSON files with a maximum of 10000 records
cat FUNCTIONS | xargs -I {} -P 10 sh -c 'target-query -q -t MSEDGEWIN10.tar -f {} --no-cache --children 2>>/dev/null | rdump --split 10000 -w export/plugins/{}.json --suffix-length 10 2>>/dev/null'

# Create records based on the datetime fields in the records and save the output in JSONL files
find export/plugins -type f -print0 | xargs -r0I {} -P 10 sh -c 'rdump {} --multi-timestamp -w jsonfile://export/$(basename {} .json).jsonl?descriptors=True'
The use of the machine type c2-standard-30 allows for the execution of all functions and output of JSONL files on the Acquire container within approximately 7 minutes. This process can be further scaled up depending on the number of processors available on the system using xargs.
Analysis
The output generated by Dissect Target must adhere to a specific format to be compatible with Timesketch. Each event must contain the following fields:
message- brief summary of the eventdatetime- ISO 8601 timestamp of when the event occurredtimestamp- epoch timestamp of when the event occurredtimestamp_desc- description of the timestamp
The standard method of uploading data to Timesketch is by uploading files in formats like Plaso, JSONL, or CSV to Timesketch, which stores the files on the filesystem or Redis (temporary) depending on the file type. However, this is an extra step if the data is to be stored in Elasticsearch.
I have added a feature to Timesketch to use data already ingested into Elasticsearch without modifying Elasticsearch documents. This feature is available in a fork of Timesketch. The feature disables the update_by_query that adds a timeline ID to every document that is part of the timeline, which can cause problems when the query is not executed properly on a large number of documents. If the timeline ID is not added to a document, the document will also not be shown in Timesketch. By using this feature, the timeline ID must be added before the data is ingested into Elasticsearch.
To prepare the records for use with Timesketch, we need to ensure they are in the correct format and uploaded to Elasticsearch. Logstash is a great tool for transforming the records into a format that Timesketch can understand and for directly uploading data to Elasticsearch.
The Logstash Dissect configuration together with the following Elasticsearch index mapping can be used to upload the contents JSONL files produced by Dissect Target to Elasticsearch.
# Retrieve the hostname of the target
export TIMELINE_NAME=$(target-query -q -t MSEDGEWIN10.tar -f hostname -d ";"  | grep -iv "none" | awk '{print $NF}')

# Create a timeline in Timesketch
export TIMELINE_ID=$(python3 -c 'from os import getenv;from timesketch_api_client import config;ts_client = config.get_client();sketch = ts_client.get_sketch(1);timeline=sketch.generate_timeline_from_es_index(es_index_name=getenv("INDEX_NAME"), name=getenv("TIMELINE_NAME"),timeline_update_query=False,provider="Dissect Target",context="Dissect Target");print(timeline.id)')

# Upload data to Elasticsearch using the timeline ID
/usr/share/logstash/bin/logstash --path.settings /etc/logstash -f /etc/logstash/conf.d/logstash-dissect.conf
The Logstash configuration uses values not set in this example that can be removed from the configuration depending on the use case.
Once the data is saved in Elasticsearch, we can conduct forensics timeline analysis of the timelines and events. This process can be automated using a processing pipeline as described in the previous blog post. I have used this method to process and perform the first analysis of 25 Acquire containers in just 20 minutes. Depending on the resources available to the Elasticsearch cluster, this process can be completed even faster.